
In the world of technical analysis, indicators are among the most essential tools used by traders to analyze price behavior, forecast trends, and identify trading opportunities. A deep understanding of indicators and how to use them effectively can significantly impact a trader's success—especially in the cryptocurrency market. In this article, we provide a complete guide to what an indicator is, the different types of indicators, and their applications in technical analysis.
What Is an Indicator?
An indicator is a technical tool based on mathematical formulas that processes historical data—such as price, volume, and time—to help traders identify market trends, entry and exit points, and overall market strength. Indicators are plotted directly on price charts (e.g., candlestick charts) and visually represent calculations through lines, histograms, or curves.
Importance of Indicators in Technical Analysis
Technical analysis is incomplete without indicators. Here are key reasons why they matter:
Main Categories of Indicators
Indicators are generally categorized into the following types:
1. Trend Indicators
These indicators help identify the overall direction of the market—whether it's bullish, bearish, or ranging.
Popular trend indicators:
2. Oscillators
Oscillators measure market momentum and identify overbought or oversold conditions. They typically move within a fixed range.
Popular oscillators:
3. Volume-Based Indicators
These indicators are derived from trading volume data and help assess the strength or weakness of price movements.
Common volume indicators:
4. Bill Williams Indicators
Created by the renowned trader Bill Williams, these indicators combine psychological and mathematical analysis of market behavior.
Notable Bill Williams indicators:
Most Popular Indicators in Crypto Technical Analysis
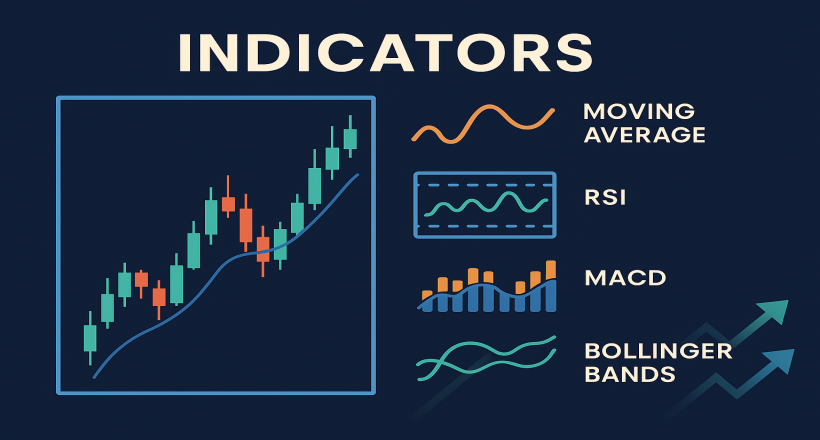
1. Moving Average (MA)
Shows the average price over a specific time period and is widely used to identify long-term and short-term trends.
2. RSI (Relative Strength Index)
Indicates overbought or oversold market conditions. An RSI above 70 suggests overbought conditions; below 30 indicates oversold.
3. MACD
Combines two moving averages to show trend direction and strength. Crossovers between the MACD and signal line produce buy/sell signals.
4. Bollinger Bands
Measures market volatility and provides insights when prices break above or below the bands—often signaling potential price moves.
Key Tips for Using Indicators Effectively
Indicators vs. Candlestick Patterns
While candlestick patterns visually represent price action, indicators offer mathematical insights. Combining both methods can enhance analysis accuracy.
Conclusion
Indicators are indispensable tools in technical analysis, especially in the dynamic world of cryptocurrency trading. Understanding the different types of indicators and applying them wisely can enhance strategy, improve trade timing, and reduce risks. Ultimately, successful trading requires a balanced mix of knowledge, experience, and analytical tools—including technical indicators.


