
The Relative Strength Index (RSI) is one of the key tools in technical analysis that many traders rely on to assess market price trends. This indicator helps analysts evaluate the momentum and strength of price movements, providing a better understanding of changes in the market.
Since identifying the right time to enter or exit trades is a major concern for financial market participants, this article aims to provide a comprehensive introduction to the RSI indicator, explain its applications, and explore how to identify various divergences using it.
Comprehensive Introduction to the RSI Indicator
One of the most effective methods for analyzing financial markets and forecasting price behavior is technical analysis—a strategy professional traders use to profit from ongoing market fluctuations. In this process, numerous tools are available to help traders closely examine market conditions and identify optimal entry and exit points.
Among these tools, the RSI stands out as one of the most popular and widely used. Known as the Relative Strength Index, this momentum indicator—abbreviated as RSI—serves to assess the strength of price trends.
Momentum indicators, like the RSI, are used to evaluate the strength or weakness in the price of an asset. For traders, gauging the intensity of bullish or bearish price movements is crucial, and RSI performs exceptionally well in this regard.
The RSI was first introduced by Welles Wilder in his 1978 book titled “New Concepts in Technical Trading Systems.” Today, traders across various markets use this indicator as a central part of their technical analysis toolbox.
Applications of the RSI Indicator in Technical Analysis
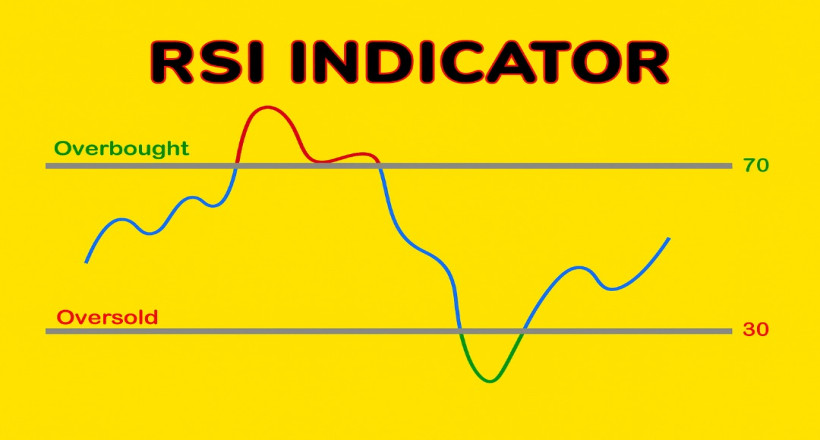
The RSI is categorized as an oscillator within technical analysis tools. Its main purpose is to measure the speed and magnitude of price changes over a defined period. RSI values fluctuate between 0 and 100, with two key levels—30 and 70—being particularly significant. Generally, the 30 level is considered a support zone, while the 70 level is viewed as a resistance zone.
When RSI rises above 70, it signals overbought conditions, suggesting that a price correction may occur—many traders take this as a potential sell opportunity. Conversely, when RSI falls below 30, it indicates oversold conditions and can be interpreted as a potential buy signal. However, it’s important to note that trading decisions should not be based solely on the RSI and are usually combined with a trader’s broader strategy.
When RSI oscillates between the 30 and 70 levels, the market is typically considered to be in a neutral or consolidating phase. In such scenarios, the market lacks a clear direction, and many traders prefer to wait for a defined trend before taking action.
Another notable feature of this indicator is its ability to help identify trendlines. By analyzing RSI behavior, traders can detect critical entry or exit points in the market. As a result, the information generated by the RSI can offer potential signals for upcoming bullish or bearish price movements.
How to Calculate the RSI Indicator
Like many other technical indicators, RSI is calculated using a specific formula. The first step involves determining the Relative Strength (RS), which is the ratio of average gains to average losses over a given period—commonly set to 14 days.
To calculate RS, first sum all gains from up days and divide by the number of those days to find the average gain. Repeat the process for down days to determine the average loss. The RS value is then obtained by dividing the average gain by the average loss:
RS = Average Gain / Average Loss
Once RS is calculated, the RSI value can be derived using the following formula:
RSI = 100 - [100 / (1 + RS)]
This formula generates a value between 0 and 100, which provides traders with valuable insights into whether an asset is overbought or oversold.
Adding the RSI Indicator to a Price Chart
To utilize the RSI indicator, there’s no need for manual calculations. On technical analysis platforms like TradingView, this tool is readily available and can be added to charts with just a few clicks.
Since RSI belongs to the oscillator category, it is usually displayed below the main price chart. Once the indicator is activated, you can clearly observe its fluctuations and identify overbought and oversold zones. This data offers a better understanding of the current market condition and supports more accurate trend analysis.
Using the RSI Indicator in Trading Strategy Design
The RSI is one of the most widely used tools in technical analysis, offering traders various ways to make informed decisions. It can be used independently or combined with other analytical tools to reinforce or confirm your analysis.
Some common uses of the RSI in trading include:
In the following sections, you’ll learn about several strategies traders use to interpret RSI signals and improve their overall trading performance.
RSI Trading Strategies Using Trendlines
Trendlines are key tools in technical analysis that help traders understand the direction of price movement. Combining these lines with the RSI indicator offers a clearer picture of potential breakouts or trend continuations. RSI enables a more accurate market analysis by highlighting trendline breaks. This indicator is effective in both bullish and bearish market phases. Below, we explain how to use RSI in each of these situations:
Using RSI in Bullish Trends
When an asset is in an upward trend, the RSI helps assess the trend's strength. If both the price and RSI are forming higher highs, it confirms the continuation of the bullish trend. In this scenario, traders often open long positions in alignment with the trend. The RSI trendline in this case acts as a support level, and as long as this support holds, the bullish momentum is likely to continue.
Using RSI in Bearish Trends
In bearish markets, RSI is also a helpful tool to confirm price direction. When both the RSI and price form lower highs and lower lows, it signals a valid downtrend. In such conditions, traders typically take short positions. The trendline formed in RSI acts as resistance, and unless this resistance is broken, the downtrend is expected to persist.
Combining RSI with trendline analysis allows traders to identify entry and exit points more precisely and make more confident trading decisions.
Identifying Trend Reversals with the RSI Indicator
One of the most powerful features of the RSI is its ability to detect trend reversals. Traders who can identify these changes early often gain a significant profit advantage. The overbought and oversold levels in this indicator serve as valuable tools for predicting such opportunities.
As the price decreases, the RSI value moves closer to zero, and as the price increases, RSI approaches 100. The closer RSI gets to either extreme, the more likely it indicates that the asset has deviated from its intrinsic or fair value. In simpler terms:
An RSI in the overbought zone may indicate weakening bullish momentum and a possible price decline. On the other hand, entering the oversold zone could signal the end of a bearish trend and the beginning of a price recovery.
In summary, closely monitoring these RSI levels can greatly assist traders in identifying optimal moments to enter or exit the market.
What Is Divergence in the RSI Indicator?
One of the most important signals when analyzing with the RSI indicator is divergence. Divergence occurs when price behavior is not aligned with the RSI's performance. In other words, the asset's price forms a new high or low, but the RSI fails to confirm this move. This inconsistency can serve as an early warning of a potential trend reversal and generally appears in two main types:
In summary, divergence between RSI and the price chart is a useful tool for identifying possible turning points in the market trend and can offer valuable opportunities for traders.
Weaknesses of the RSI Indicator
Like other technical analysis tools, the RSI indicator has its limitations and cannot be considered a flawless or always-profitable solution in financial trading.
Some of the challenges traders may face while using RSI include false signals or misinterpretations in certain market conditions. During strong and high-momentum trends, the RSI may fail to deliver reliable or accurate performance, potentially leading traders to make incorrect decisions.
Additionally, the RSI can remain in the overbought or oversold zones for an extended period without any significant price reversal. In such cases, analysts may struggle to accurately predict the market’s next move, increasing the risk of confusion.
Reasons for RSI's Popularity Among Analysts
Despite the limitations mentioned above, RSI remains one of the most widely used tools in technical analysis. Many traders and investors rely on it to assess market conditions. Some of the key advantages of this indicator include:
Conclusion:
The RSI indicator is one of the most popular tools in technical analysis, used by a wide range of traders—from beginners to seasoned professionals. Its simplicity and ease of interpretation have contributed significantly to its popularity in trading environments.
RSI generally performs well in identifying suitable levels for buying or selling and is often used as a reference for making trading decisions. However, while RSI is a powerful tool on its own, it's best to use it in conjunction with other indicators and techniques to enhance analytical accuracy.
Combining RSI with other indicators—such as MACD, moving averages, or volume analysis—can reduce the likelihood of errors and provide a more comprehensive view of market trends. Therefore, intelligent use of RSI alongside complementary strategies can lead to more confident and reliable trading decisions.


