
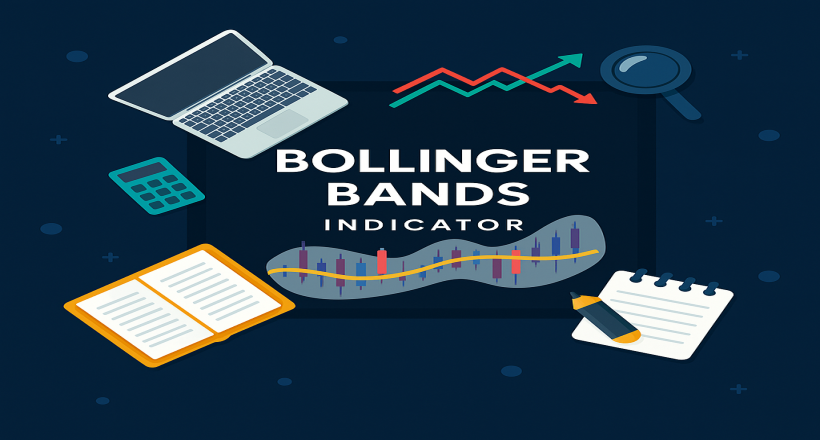
Among the many tools used in technical analysis, Bollinger Bands stand out as one of the most accurate and practical indicators for examining price volatility and predicting market behavior, especially in the realm of cryptocurrencies. This specialized indicator was developed by renowned financial market analyst John Bollinger, and it leverages key statistical concepts—particularly standard deviation and simple moving average (SMA)—to help traders analyze price behavior over various timeframes.
Bollinger Bands consist of three primary lines, where the space between the upper and lower bands illustrates the price volatility range. These lines adjust dynamically in response to changing market conditions. In essence, this powerful tool helps traders more precisely identify entry and exit points—especially in volatile markets such as cryptocurrencies.
The original concept for this indicator was introduced in the 1980s, but its application in the crypto market began around 2011. Since then, Bollinger Bands have become an essential feature in most advanced trading platforms and analytical systems.
The core function of this indicator is to measure price volatility by calculating standard deviation around a moving average. This enables traders to interpret the current price in comparison to its historical behavior and develop suitable trading strategies.
If you're aiming to become a more precise and professional trader in the cryptocurrency space, mastering the Bollinger Bands indicator is a crucial step toward smarter and more informed decision-making. In the following sections, we’ll explore its structure, use cases, and trading strategies.
In-Depth Understanding of Bollinger Bands: A Practical Tool for Measuring Market Volatility
Among the analytical tools employed in financial markets, the Bollinger Bands indicator holds a special place. This innovative tool, designed by seasoned analyst John Bollinger, has evolved significantly over the years. Initially used solely to assess trading ranges, it has now become a core component of technical analysis, playing a vital role in identifying trends, volatility, and optimal trade entry or exit points.
The Three-Part Structure of Bollinger Bands
The Bollinger Bands indicator is composed of three dynamic curves plotted around the price:
This tripartite structure allows traders to visualize and analyze price behavior within a clear framework. The middle band (SMA) reveals the overall direction of the trend, helping analysts determine whether the market is in an upward or downward phase.
The Role of Standard Deviation in Band Formation
A fundamental element in the functioning of Bollinger Bands is the use of standard deviation—a statistical metric that gauges the degree of price fluctuation. The greater the volatility in price, the wider the bands become; conversely, during periods of reduced market movement, the bands contract.
This dynamic behavior offers a visual representation of price range and volatility, allowing traders to identify potential breakouts, trend reversals, or consolidation phases.
Proper Interpretation of Bollinger Bands in Market Analysis
Bollinger Bands not only highlight the highs and lows of price over specific timeframes but also help users evaluate the current price relative to its historical behavior. Within this framework:
However, it’s important to note that reaching either band does not necessarily mean a trend reversal is imminent. A common mistake among less experienced traders is assuming that a price touching the upper band will immediately fall, or that touching the lower band guarantees a price increase. This is a dangerous misconception that can lead to poor decisions and significant losses.
Bandwidth Changes: A Reflection of Market Dynamics
Another critical feature of the Bollinger Bands indicator is the bandwidth, which dynamically adjusts based on market volatility:
Monitoring these changes enables professional traders to detect potential breakout zones and prepare trading strategies accordingly.
Practical Applications of Bollinger Bands in Price Behavior Analysis
The primary purpose of Bollinger Bands is to identify potential overbought and oversold zones. This tool is not only effective in tracking market trends, but also plays a vital role in detecting price breakouts. For this reason, many experienced traders consider Bollinger Bands one of the essential indicators for analyzing volatility.
Here are four key principles to guide traders in using Bollinger Bands effectively:
1. Combine Bollinger Bands with Other Indicators
When price approaches either the upper or lower band, it is essential to cross-reference with other indicators such as RSI, MACD, or trading volume. If multiple tools confirm a potential reversal or trend continuation, the signal becomes more reliable. If not, traders should proceed cautiously and consider the possibility of a short-term correction.
2. Price Moves Beyond the Bands May Signal Reversals
When candlesticks clearly break outside the upper or lower bands, this can often be interpreted as a warning of a potential price reversal. While these events may be brief, they typically do not persist unless confirmed by additional trend indicators.
3. Analyze Price Behavior Between Upper and Lower Bands
Price movements from the lower band toward the upper band, or vice versa, offer valuable insights into the strength of the trend or a possible market shift. These patterns, especially when accompanied by volume surges or indicator divergences, deserve close attention from traders.
4. Low Volatility Precedes Strong Breakouts
When the market enters a calm or inactive phase and the bands become unusually tight, this often serves as a precursor to significant price movements. Historical data shows that during these low-volatility periods, the likelihood of sharp breakouts increases. Traders should remain vigilant and ready to act on such signals.
Key Applications of the Bollinger Bands Indicator in Market Behavior Analysis
Below are some of the most important capabilities and patterns that can be extracted from the Bollinger Bands indicator, which are highly useful in making strategic trading decisions:
Bollinger Band Squeeze: A Powerful Signal
One of the most impactful concepts within Bollinger Bands is the “Squeeze.” When the upper and lower bands draw unusually close together and the price range becomes narrow, it indicates that the market has entered a low-volatility phase. During this period, the moving average is positioned between the two compressed bands—signaling price stagnation or consolidation.
This setup often acts as a warning of an upcoming significant price movement. While Bollinger Bands alone do not determine the direction of this move, professional traders recognize the squeeze as a potential trading opportunity. The narrower the bands become, the higher the probability of a sudden breakout.
Band Breakout: Interpreting Price Exits
More than 90% of price data usually remains within the upper and lower Bollinger Bands. When the price breaks outside one of the bands, it is referred to as a Breakout.
A common mistake among novice traders is assuming that a price moving above the upper band is a sell signal, and movement below the lower band is a buy signal. In reality, exiting the bands only indicates increased volatility, not necessarily a specific direction.
Bollinger Bands highlight the current price in relation to its typical range, but they should not be interpreted alone as definitive buy or sell signals. Breakouts should always be confirmed by additional indicators or volume data.
Reversal Signals: Identifying Price Turnarounds
One of the key professional uses of Bollinger Bands is to identify potential price reversal points. When price candles temporarily exit the bands but quickly return within, it may signal a market correction or reversal.
This typically happens after extreme price movements that throw the market out of equilibrium. In simpler terms, sudden exits from the bands can be signs of overbought or oversold conditions, indicating readiness for a pullback or counter move. Experienced analysts use this behavior to detect local tops and bottoms.
How to Use Bollinger Bands in Crypto Trading
To use Bollinger Bands as an intelligent analytical tool, traders must understand what each structural change in the bands signals. Proper interpretation of data and timely reaction are key to navigating the high-volatility world of cryptocurrency.
Here are five essential tips to help you apply this indicator effectively:
1. Narrow Bands: The Calm Before the Storm
When the distance between the upper and lower bands decreases, it reflects low market volatility. This phase, known as a “Squeeze,” is often a precursor to a strong, sudden price movement. Smart traders use this as a signal to prepare for potential entries.
Note: Sometimes, after an initial sharp move, the market quickly reverses. Therefore, using confirmation from other tools is essential.
2. Band Expansion: Indication of a Volatility Peak
When the bands widen significantly, it often signals that volatility has temporarily peaked. In many cases, this condition is followed by a return to more stable or calm price behavior. Traders can interpret this as a sign that the current trend may be nearing exhaustion.
3. Price Swings Between Bands: Profitable Trade Patterns
A cryptocurrency price may form near the lower band and then move toward the upper band after breaking through the moving average. This pattern is considered a targeted movement within the Bollinger channel, and the upper band can serve as a profit-taking level.
Example: If Bitcoin's price bounces from the lower band, crosses above the midline (SMA), and continues upward, there's a strong chance it will reach the upper band—presenting a clear profit opportunity.
4. Full Price Exit Beyond Bands: Sign of Strong Momentum
When the price completely breaks out of both bands, it may signal the start of a high-volatility trend phase. This condition often marks the beginning of a new market move, requiring traders to manage risk tightly and seek confirmation from other technical indicators.
5. Layered Analysis: Combining Bollinger Bands with Other Tools
While Bollinger Bands provide valuable insight into volatility and price ranges, for higher accuracy, they should be combined with other indicators such as the Relative Strength Index (RSI), MACD, or trading volume. This multi-layered approach reduces false signals and improves decision-making.
Advantages and Disadvantages of Bollinger Bands
Advantages:
Disadvantages:
Conclusion:
As one of the classic tools of technical analysis, the Bollinger Bands indicator holds a unique position in evaluating volatility, identifying trends, and spotting entry/exit points in the crypto market.
Although it may not be sufficient as a standalone strategy, combining Bollinger Bands with other technical tools greatly enhances your analytical power.
Using Bollinger Bands properly allows crypto traders to:


